Fix your Optimizely Search (Find) indexing exceptions!
I’ve been looking at memory dumps too much. Sometimes I get a gut feeling that there might be something wrong looking at the memory utilization charts, but tracking down memory issues takes quite some effort. In this blog post I’ll explain why you should take a look at your Find indexing job logs, fix any exceptions there and make sure you adhere to the attachment size limits.
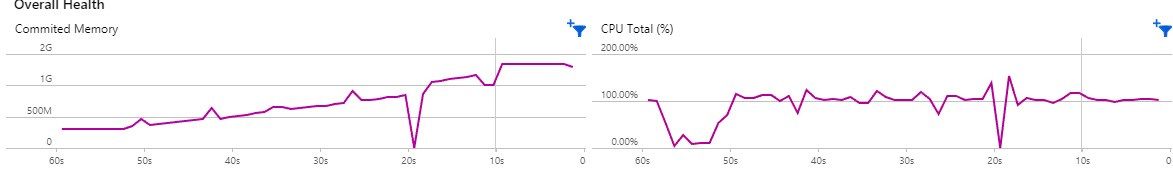
For most of our sites we use Application Insights for application monitoring and performance metrics. I noticed big spikes in memory usage when our CMS and Commerce content is being indexed, which kind of makes sense because the job will go through all of the content and part of that content will remain cached afterwards. On one of our customer projects the memory pressure was a lot higher than expected. I decided to take some memory dumps and start the investigation.
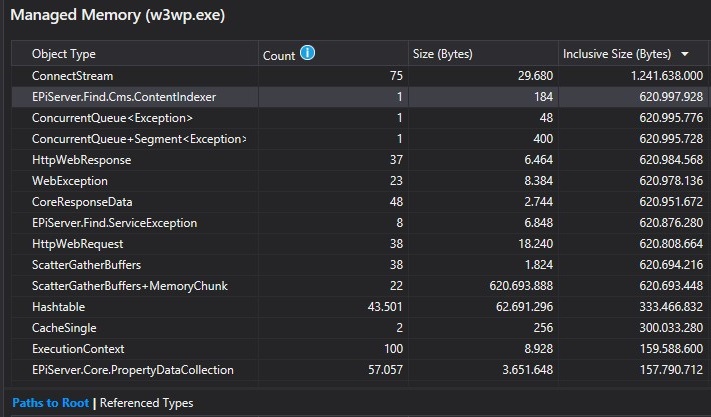
Here we see that the ContentIndexer is using quite a significant huge amount of memory. These are the inclusive bytes however, the issue is not the ContentIndexer object itself but everything it holds a reference to. While I mentioned that indexing will cause content to be cached; that cache should not add up to the memory usage of the indexer itself. For some reason it holds a reference to some objects that add up to 600MB. A little bit further down the list we find the objects that take up so much memory: ScatherGatherBuffers+MemoryChunk.
What could be the the relation between the ContentIndexer and these ScatherGatherBuffers+MemoryChunk?
When we look at the actual instances (thanks for the reminder Valdis), we on top of the core issue.
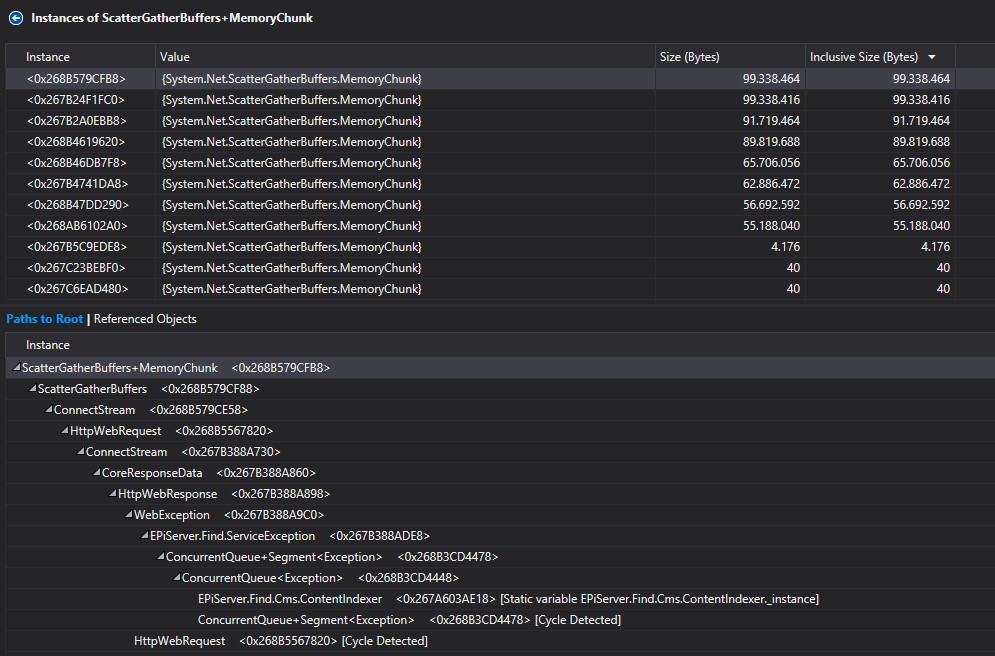
The indexer tries to index all items, serializing its content in the process. Whenever there’s an exception the indexer adds the exception and the batch of content to a list in order retry indexing later on. For example trying to recover from a 427 request too large exception with a smaller batch size. When a lot of exceptions happen, and the content or its attachment size is large, this can cause massive memory pressure even to the extent of recycling the process!
An unhandled exception occurred and the process was terminated.
Application ID: /LM/W3SVC/1061681031/ROOT
Process ID: 2184
Exception: System.OutOfMemoryException
Message: Exception of type 'System.OutOfMemoryException' was thrown.
StackTrace:    at System.Net.ScatterGatherBuffers.AllocateMemoryChunk(Int32 newSize)
The issue we had could partially be fixed in our own implementation, for each attachment we should verify ourselves if it’s not too big to index. If you don’t do that, an exception will be thrown as the Find backend will not accept the too large attachment. Therefore be sure to adhere to the attachment size limits.
The example provided by Optimizely works but can be improved to speed up indexing performance. As-is it will have to load all attachment every time it indexes, even the large attachments which can’t be indexed. An improved solution would be to store the file size in a property while saving the media data. The find index job can then just skip the files by checking that property, instead of loading the attachment and checking its size each time during indexing.
I’ve provided feedback to Optimizely to see if they can add attachment size checking in the library, as it will simplify implementation for partners (can’t forget to check size) and reduce load on the Find backend services.
But wait.. why are the exceptions using so much memory?
While I showed you what was using the memory, I didn’t explain why the exceptions are using up so much. By reading the instance path we can explain what happens:
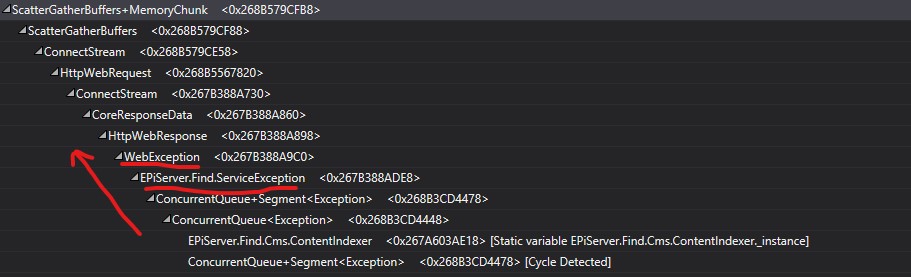
Reading from the ContentIndexer up the path we find a ConcurrentQueue (used for indexing) and a Find.ServiceException. This in turn contains a WebException and then goes all the way up to the ScatherGatherBuffers+MemoryChunk. What this means is that the Find.ServiceException actually has a reference to a WebException, which turns out to be the inner exception. From what I could see, is that there is little need to keep the actual WebException alive. Instead of using it as an inner exception, just extract whatever information you need: e.g. which type of exception is it, check if it’s possible to recover from the exception by retrying.
Decompiling and drilling down confirmed these findings. As said the solution for Optimizely to fix this is relatively simple: extract whatever information they need from the WebException but don’t add it as inner exception. Optimizely has recognized this bug and it can be found in the bug tracker: FIND-9858.
The key takeaways are:
Tip 1: Try to fix all exceptions that are thrown during indexing, it will speed up indexing and prevent unneccesary memory usage.
Tip 2: Be sure to put a size limit on media data attachments, either using the provided code by Optimizely or by storing the size upon saving the file and filtering out all large attachments
Tip 3: In general: Think about your exceptions, what do you want to do with them? If you keep them alive try to extract what you need instead of storing everything