Episerver on Azure: finding a memory leak
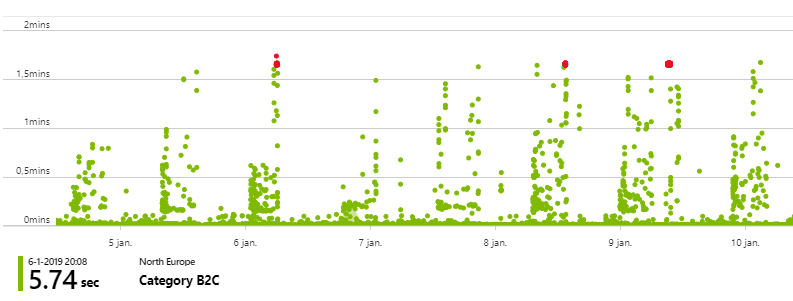
Tracking down performance issues can be tricky as they can be caused by many things. Somewhere this week I noticed some performance issues on one of our sites. Every day, the site seemed to slow down for quite a while. Not all requests were affected, only some, but it was quite clear that there was something wrong. Looking at performance data for a full week it looked like there was a pattern to these issues, however they did not seem to occur on a specific time of the day. Double checking our scheduled jobs satisfied my expectations, it wasn’t caused by any (heavy) import job. Finding the pattern was quite easy, just look at the chart below, tracking it down might be a bit harder. Below you see the availability chart which tracks both availability and request performance.
As we’re running on Azure, Diagnose and solve problems led me to the memory health chart, which uncovered the likely root of our issues.
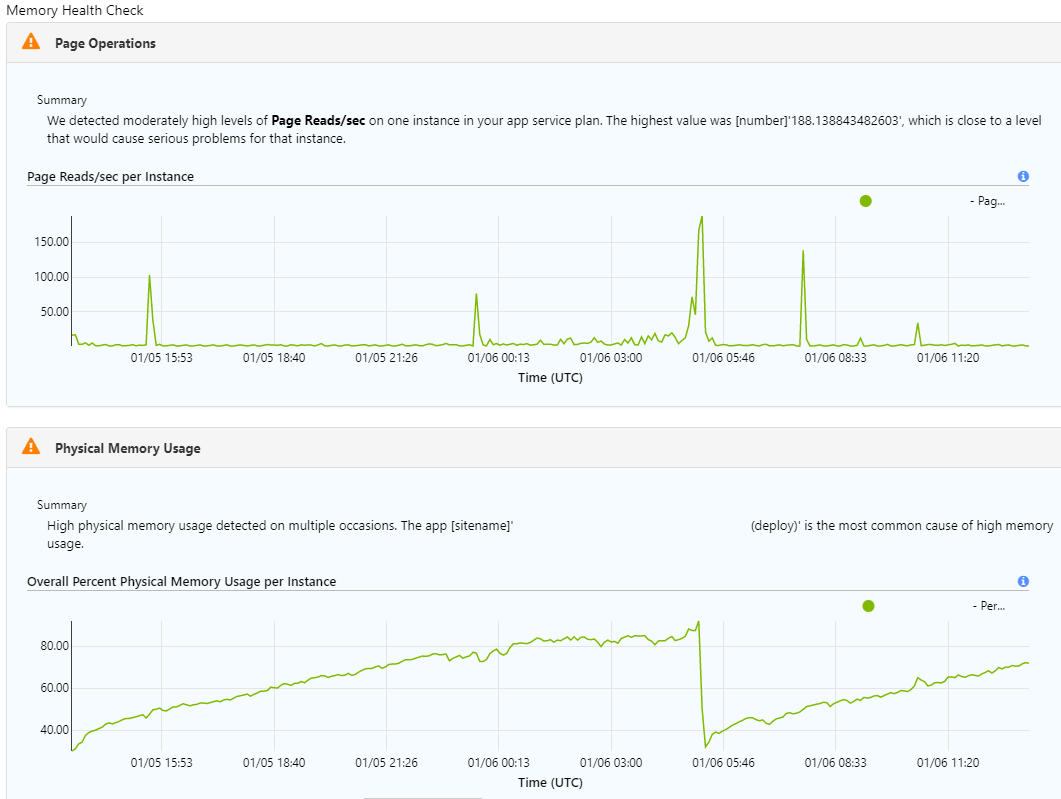
We’re looking at a time frame of 24h here, the memory usage drop in the morning of 01/06 wasn’t caused by a big GC (well sort of 😋), it was caused by a recycle. The reason for the recycle I found in the LogFiles/eventlog.xml file by using Kudu SCM
<Events>
    ...
    <Event>
        <System>
            <Provider Name="W3SVC-WP"/>
            <EventID>2299</EventID>
            <Level>1</Level>
            <Task>0</Task>
            <Keywords>Keywords</Keywords>
            <TimeCreated SystemTime="2019-01-06T05:10:48Z"/>
            <EventRecordID>x</EventRecordID>
            <Channel>Application</Channel>
            <Computer></Computer>
            <Security/>
        </System>
        <EventData>
            <Data>Worker Process requested recycle due to 'Percent Memory' limit. Memory Used: 3453165568 out of 3757625344 available. Exceeded 90 Percent of Memory
</Data>
        </EventData>
    </Event>
    ...
</Events>
Comparing memory dumps
As there’s something building up over time I thought it made sense to compare two memory dumps, taken at a different point in time. I took one in the afternoon and one in the evening. Taking a memory a memory dump on Azure is very easy:
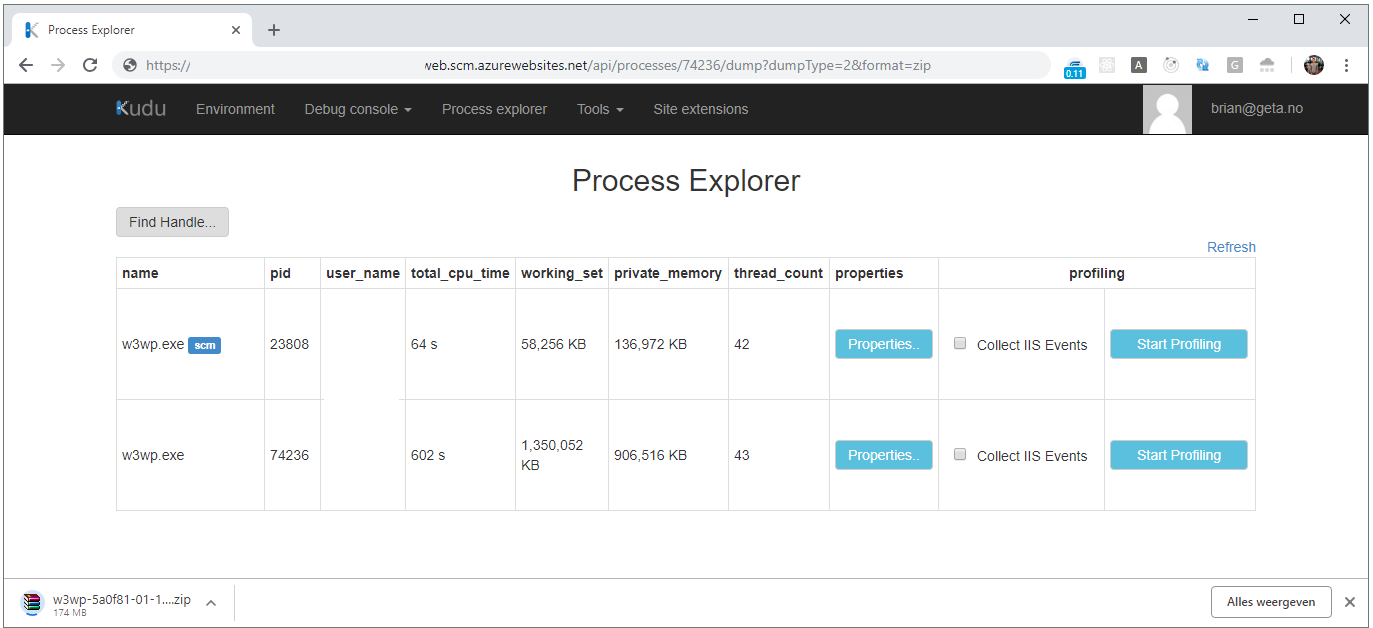
- Go to KUDU SCM and open the process explorer (for example https://<my-example-site>.scm.azurewebsites.net/ProcessExplorer/)
- Look for the w3wp.exe process without the
scmlabel and copy thepid - Browse to https://<my-example-site>.scm.azurewebsites.net/api/processes/<pid>/dump?dumpType=2&format=zip
- This will generate a
full memory minidump of process with id. This will include matching sos.dll and mscordackws.dll in the zip package.see docs - NOTE: This will make your site unresponsive for a couple of minutes
- This will generate a
- Wait for the download and unzip to a folder
I tried some other options for taking a memory dump as well, however I ended up with a corrupted dump twice. It’s so easy to take a memory dump with the procedure I just described that I won’t bother doing anything else in the future.
Now we’ll start to analyze the memory dumps, as I said I decided to compare both .dmp files.
- Open windbg, open the
.dmpfile - Wait for it to load, run the following commands to inspect memory location in the heap. This might take a couple of minutes
.load D:\windbg\my-example-site\w3wp-5a0f81-01-09-20-38-16\sos.dll
!dumpheap -stat
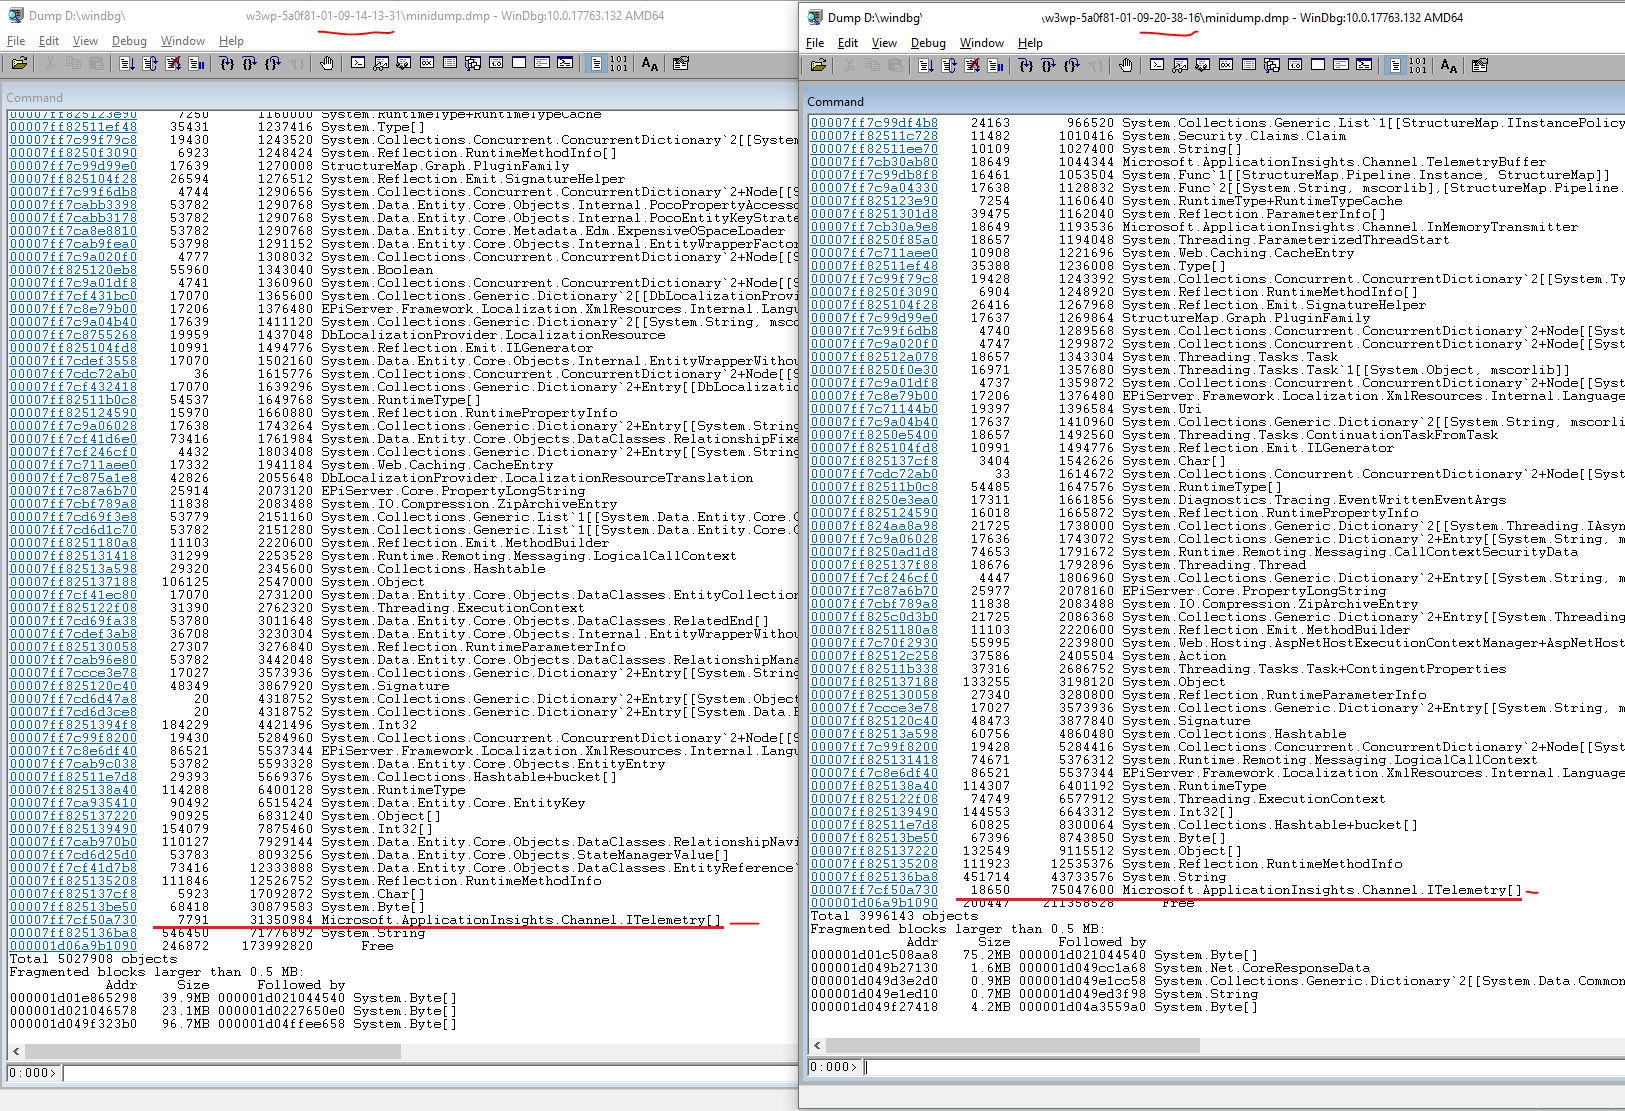
To be honest, I was not completely sure what I was looking for. However one thing caught my attention right away. For some reason we have loads of ITelemetry objects in memory, almost 7.8k in the afternoon and 18.65k in the evening. This does not make sense as these should be flushed quite regularly, indicating some misconfiguration of Application Insights. I decided to remove some of our custom tracking to see what happened.
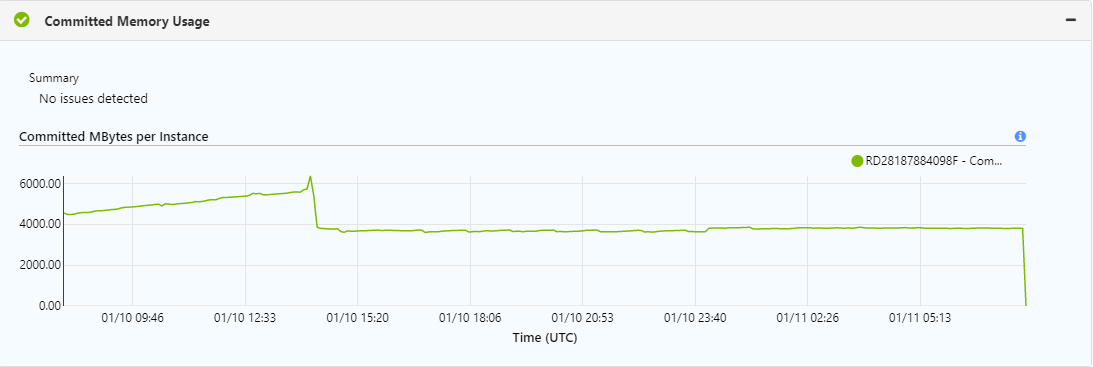
After the release around 14:00 you see the memory drop and, as I hoped, we don’t see that nasty slope on our memory usage chart anymore. It turns out our memory issues were quite obvious and easy to track down. I hope this post is of any help, for me it was great to find out how easy it is to take a memory dump on Azure.