Epi Commerce: tracking down a performance regression
Last week I helped tracking down a performance issue in one of our projects. The project is quite interesting, it’s using a multi-site architecture and offers e-commerce to both B2B and B2C customers in various different markets. We’re using multiple product catalogs, with some products only available in one of the catalogs while other products are available in multiple catalogs.

Lately we noticed some performance regressions, which often happen as you start importing more and more content and the size of your solution grows. As we’re hosting on Azure, we could see in the event log that the app pool sometimes recycles, usually due to memory constraints. Once we had a representable size catalog, the performance issues were really apparent, especially on category pages. On these pages we rely on Episerver Find in order to search and filter through our catalog data, offering a list of products and various options for sorting and filtering. The catalog has a moderate size, totaling up to around 260k items in the index, a number Episerver Find can easily handle.
A colleague noticed something weird: “In smaller categories, it works pretty fast. In larger categories, it fails.”. The fact that category size affects performance to the point that it fails is very strange, it shouldn’t even affect the performance of the page that much at all. Therefore he verified our find queries but to no avail “I checked the code and it was loading only one page at a time. Not sure how category size affects it.”.
I was asked if I could to dig into this problem and figure out what was happening. Using Application Insights Live Metrics Stream I noticed we were doing a lot of database queries per second, with spikes up to 2~3k, without heavy user load. While profiling locally I noticed the same. The amount of queries on every page load was very high.
The problem and the plan
We need a game plan, let’s write down some observations:
- Find index should be able to handle this easily
- We do retrieve paginated content, but category size seems to affect page performance
- Reloading the category page is slow
- Are we doing heavy calculations?
- Page performance doesn’t seem to improve, is the content we use being cached?
Quite often we rely heavily on the fact that content is being cached by Episerver. You might not want to rely on the caching of all content items, especially on a category page like ours. If you use Epi Find, you can choose to add additional data to the Find index and retrieve it directly from the index using projections. This way you will not have to load the content item itself, but use the data from the index. The first thing I did was remove some code which still relies quite heavy on cached content, however it did not seem to impact the performance that much. It struck me that removing URLs from our ViewModel seemed to have a big impact… 🤔
Visual Studio CPU profiling to the rescue
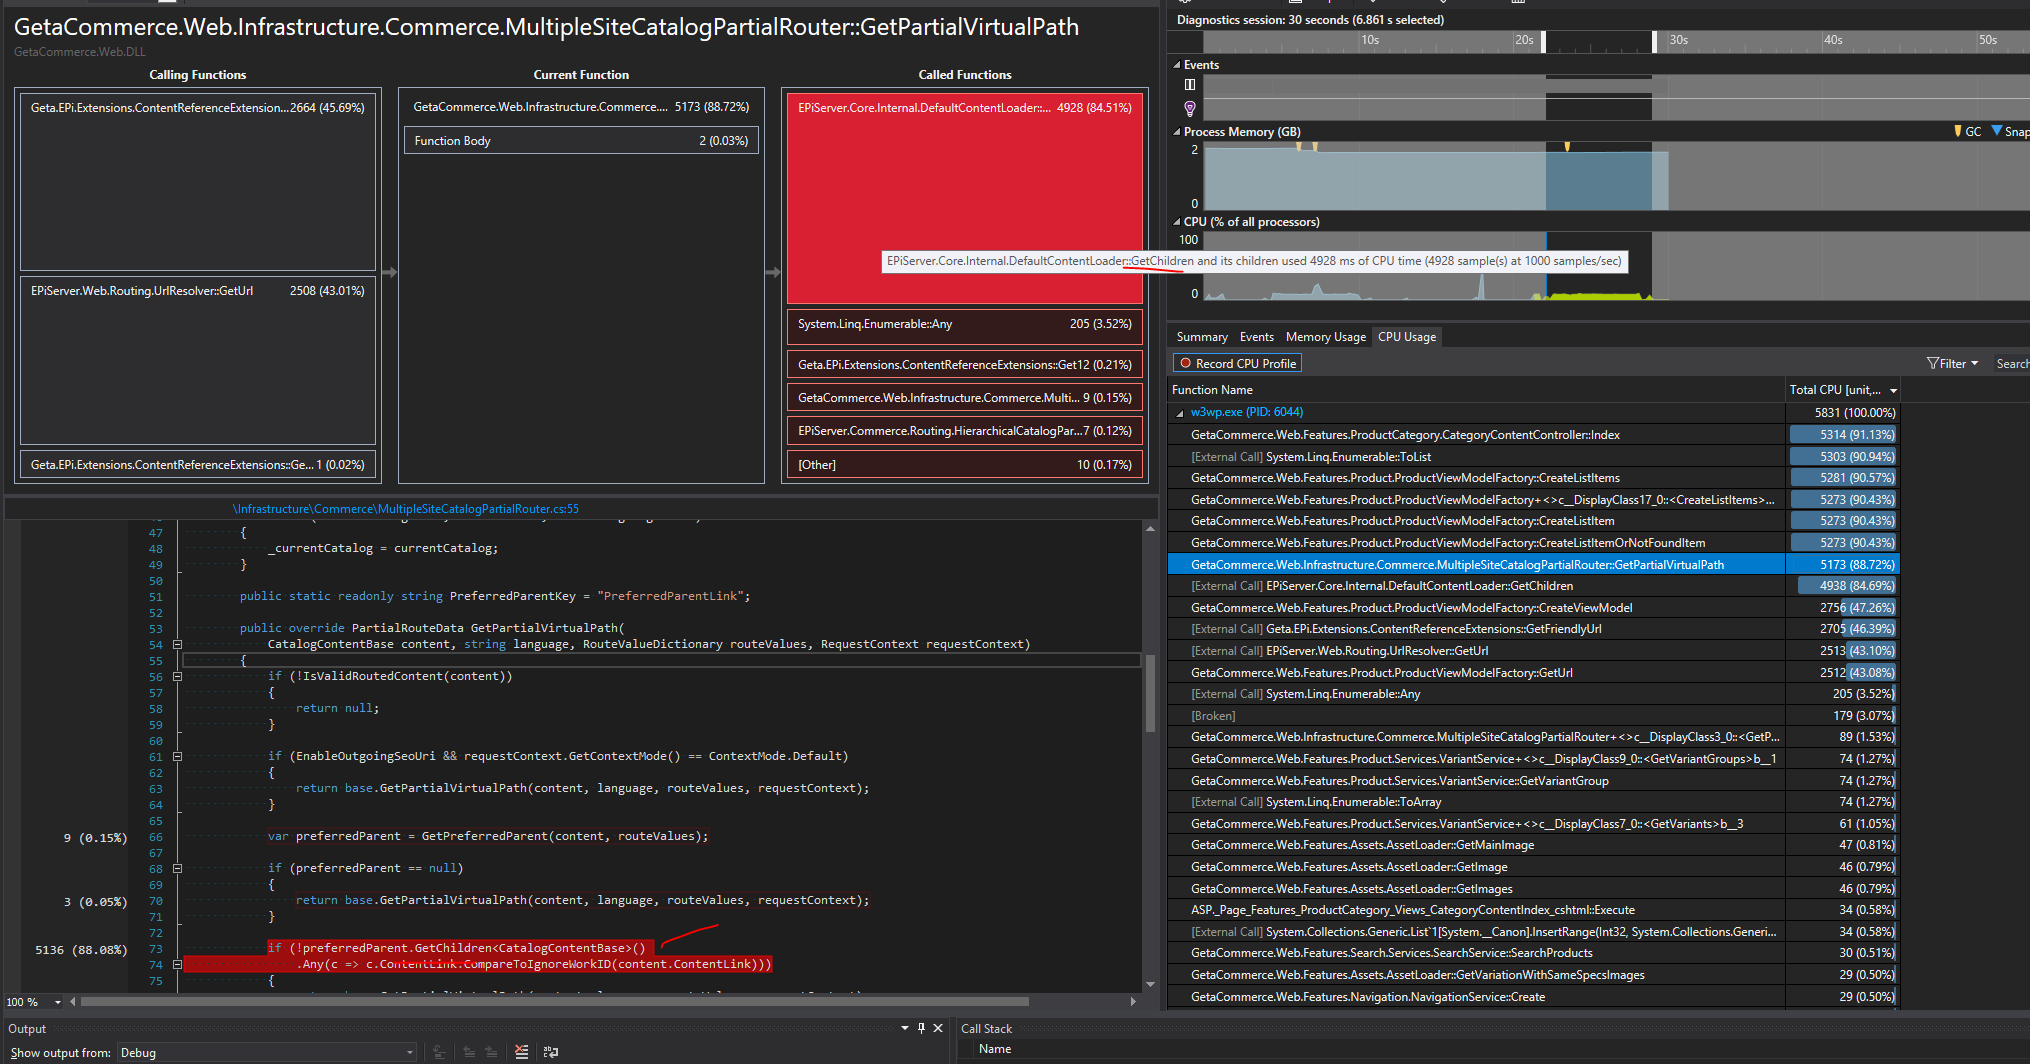
As with my previous blog about a memory leak, I was quite lucky this time as well. Even though I was quite confused when I ran the CPU profiler, it was not hard to find the root of the problem. The screenshot shows the CPU time for loading a category with 1200 products, displaying only 40 products on the page, with around 5 variations each. As you can see it took almost 6 seconds of CPU time!
As mentioned, this solution has multiple sites, but more importantly, it has multiple catalogs as well. The structure of these catalogs is not similar to each other and catalog content can be linked to multiple parent categories. By default Episerver only supports generating the url for the primary category, fortunately there’s a nice blog post on Episerver world by Magnus Rahl about creating a context aware router. The router seemed to work for us as well, allowing us to generate a URLs using the non primary categories of a product.
If you look at the screenshot above, it turns out that 88% of the CPU time was spent in the GetVirtualPath method of the catalog content router, which is used to generate URLs for catalog content (for example URL to product detail page). A bit further down the line we see that most of the time is spent in DefaultContentLoader.GetChildren (dare to guess where the db load was coming from?).
Our categories are quite big, when I debugged the code below it turned out we had 5k+ children for one single category.
if (!contentLoader.GetChildren<CatalogContentBase>(preferredParent)
    .Any(c => c.ContentLink.CompareToIgnoreWorkID(content.ContentLink)))
{
    return base.GetPartialVirtualPath(content, language, routeValues, requestContext);
}
Reading the blog post again I found the reason for this if statement: “But other than that the logic is simple: If there’s a preferred parent supplied, see if the routed content is actually a child of that content and in that case create a URL based on that parent instead.”
In our case I decided to remove the check, a different option would be to verify that the content has the preferredParent as an actual parent. I think that product often have just a couple of parents, whereas categories can have a lot of children.
// WARNING: untested
// Using find extension method to get parents
var parents = content.ParentNodeRelations();
if (!parents.Any(x => x.Equals(preferredParent)))
{
    return base.GetPartialVirtualPath(content, language, routeValues, requestContext);
}
This one if statement proved to be the main cause of our problems, after removing it our category page loads in ~500ms again with the router using just 19ms (3.5%).
